
It is amazing how technical analysis can inform us of the fundamentals!
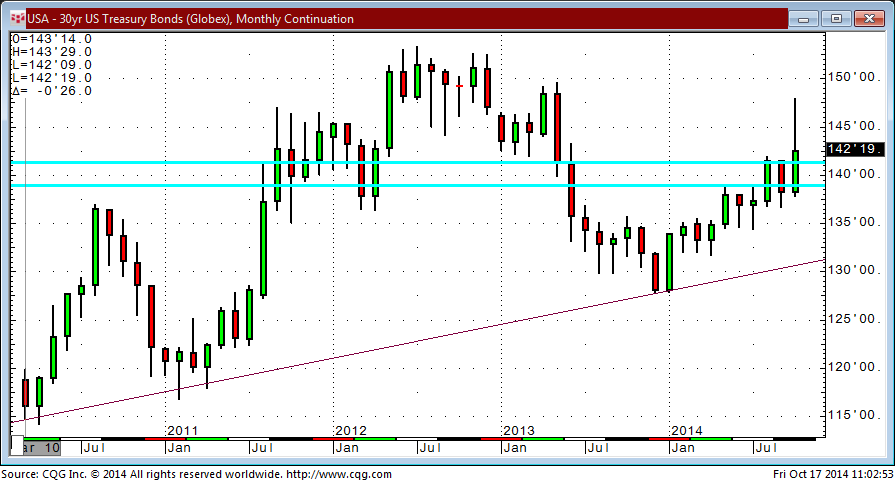
Recently, a look at the 30 year futures proved very interesting. Take a look back at the entry, BIG PICTURE ANALYSIS OF 30 YEAR FUTURES: UP WHERE THE AIR IS THIN, and see the several interesting questions that the chart begged to be asked. At that time, we saw the 30 year futures contract trading between the 138 and 141 handle. The last time the contract rallied into this range it stayed at or above this level for 20 out of 21 months. It was mentioned in this analysis of the 30 year futures price action that the trading at this high level coincided with unprecedented accomodative monetary policy.
Let’s now move our focus to the 10 year futures – what could give us a view more balanced between two key points of term on the yield curve.
(Below is a monthly chart of the 30 year and 10 year futures contracts for comparative purposes.)
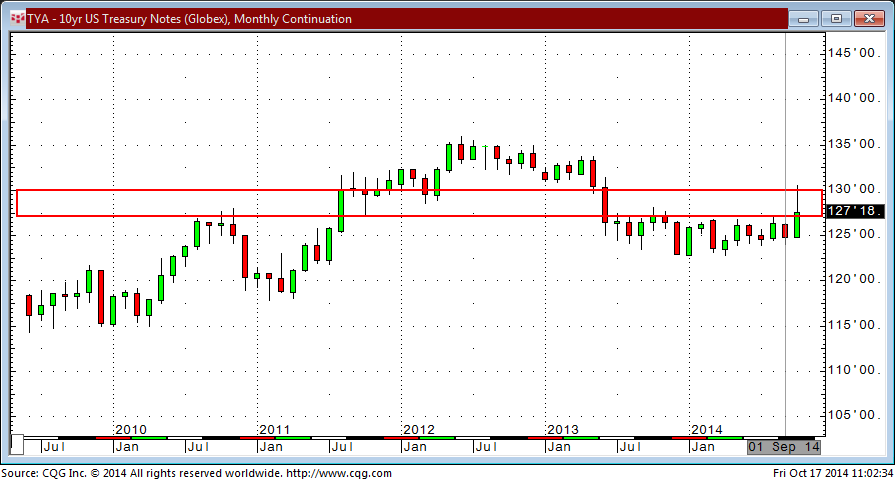
When comparing the two charts with a view of the rectangles that encapsulate the space and range that is of interest, the recent strength of the 30 year futures versus the 10 year futures seems noteworthy.
Here, in considering the implications from a yield curve perspective: the technicals are expressing that the downturn in the outlook for the US and global economies is provoking more vigorous buying of the 30 year than the 10 year. The flattening of the yield curve between these maturities – the 10 year versus the 30 year – has been a persistent trend throughout 2014. The big question that this observation and the current sell-off in equities begs is: will the buying of the 10 year catch up to the 30 year?
To answer this question, we must recognize the context of an era.
Perhaps the greatest story that the price pattern of both the 10 year and the 30 year conveys is overarching Fed intervention. Any consistent observer of the markets knows that the dominant, ubiquitous force within the markets is Fed policy.
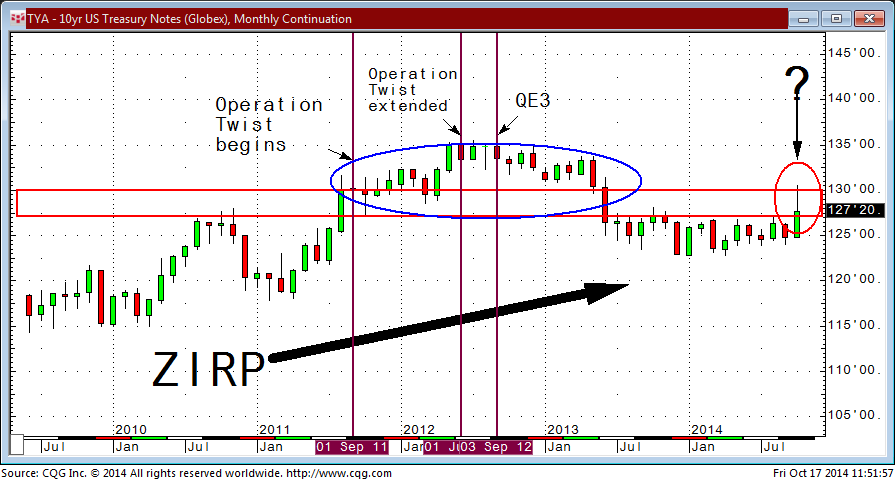
- From December 2008 to present, the Federal Reserve has had in place a Zero Interest Rate Policy, or ZIRP as many call it. (The chart below indicates the obvious general effect this has had on the 10 year futures.)
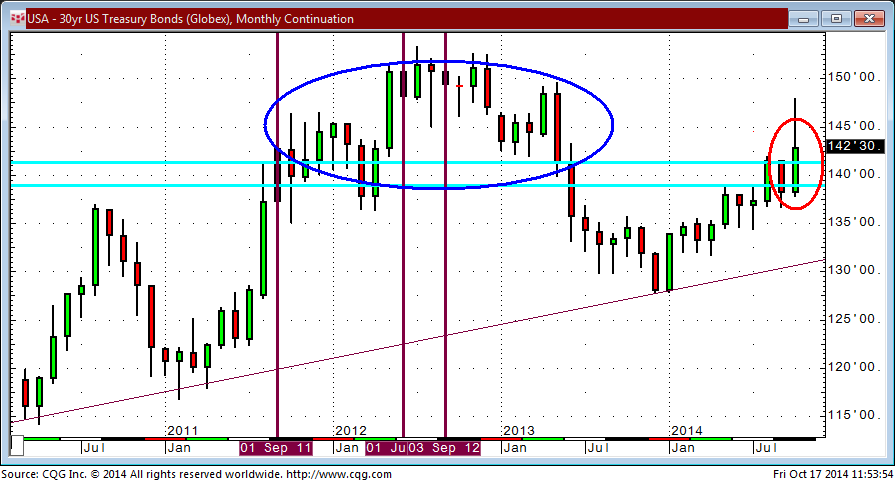
Within this “era of ZIRP”, many various actions have been implemented by the Fed. Take a look at the effect of each action since September of 2011 that can be seen in the charts below with added notations.
Is “QE4-ever” next?
A studied and professional eye cannot help but ask this question. The dollar is strong. Deflation is the persistent concern. If the charts are signalling anything “fundamental”, they might be signalling the greatest fundamental – MORE FED STEERING!

[…] to grow. The headline that is the most significant and is the greatest fundamental (mentioned in “Technicals Inform the Fundamentals: QE4ever?”) is not mentioned by the financial pundits – WE ARE IN THE ERA OF THE CENTRAL BANK AS CENTRAL […]
[…] The prolonged execution of Global ZIRP was suggested in Technicals Inform the Fundamentals: QE-4EVER?. […]
[…] course Fed policy which the Mixed Market Artist referred to as the “greatest fundamental” in a previous post. An aspect to a new cycle we may be entering might be a persistently strong US Dollar. How the […]
[…] to grow. The headline that is the most significant and is the greatest fundamental (mentioned in “Technicals Inform the Fundamentals: QE4ever?”) is not mentioned by the financial pundits – WE ARE IN THE ERA OF THE CENTRAL BANK AS CENTRAL […]
[…] Fed policy which the Mixed Market Artist referred to as the “greatest fundamental” in a previous post. An aspect to a new cycle we may be entering might be a persistently strong US Dollar. This […]