Read Time:32 Second
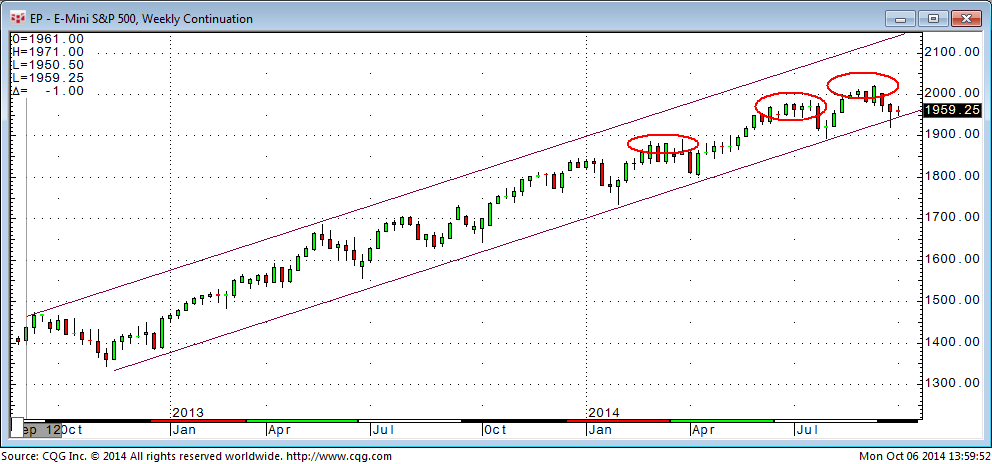
Take a look at the trend channel and the ellipses drawn into the weekly chart of the Standard and Poor 500 futures chart. The rally of 2013 pictured in the chart sure does appear very persistent and orderly! (Easy money policy works?)
Failing to rally this week will bring us closer to penetrating the bottom trend-line at 1950.50. Obviously, breaking below that level this week appears very significant on this chart.
Also, notice the lower highs between the second and third ellipses. This loss of momentum combined with a violation of the trend-line is what we have not seen in almost two years.
About Post Author
William Lee
Billy Lee, CEO of Great White Financial, is a sportsman, businessman, artist, speaker, writer, and producer.
Billy is the Founder of the Wellness Institute for Economic Growth and Kairos Athletics.


[…] observing the technical analysis of the last post on the S and P 500 futures, observe the next level where we might expect to see consolidation – around the psychological […]