Are European vacations becoming affordable again?
The highly touted common currency floated by the European Union just over a decade ago looks to be headed back to its roots. Many have talked or written about the current strength of the dollar versus the euro, but few resources will as dramatically present the recent thrashing as the Mixed Market Artist does.
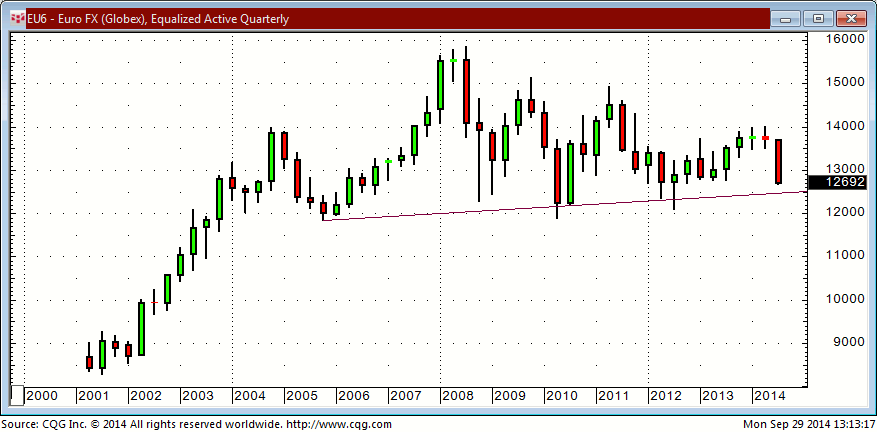
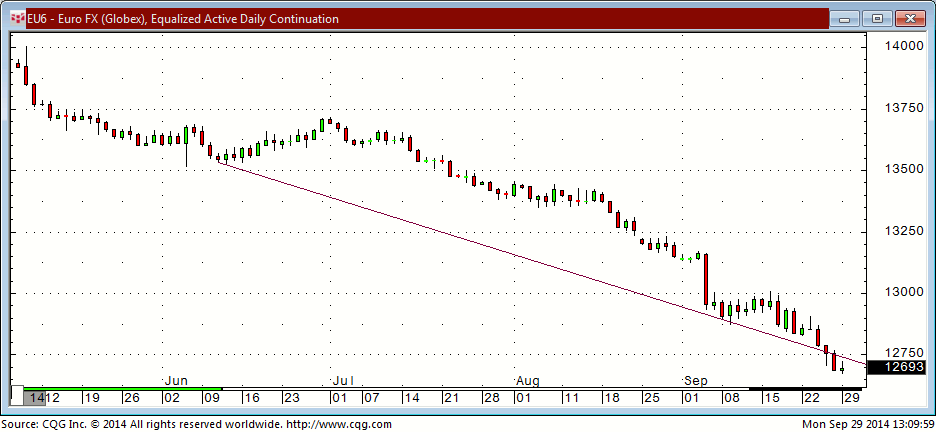
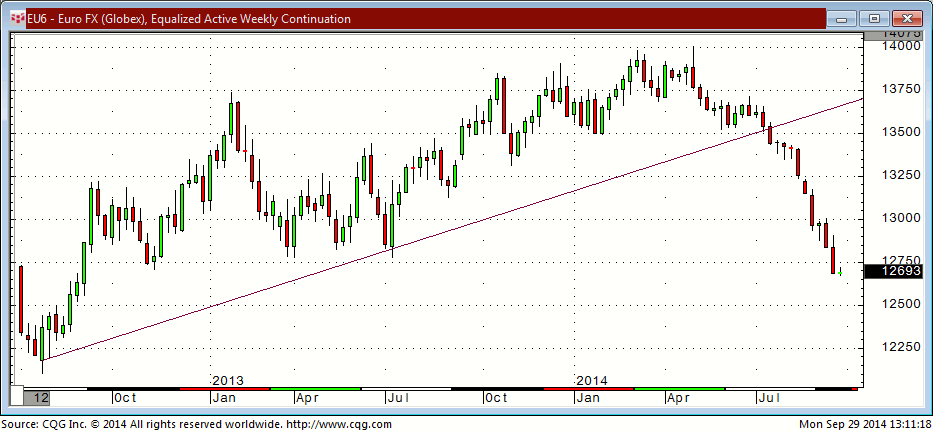
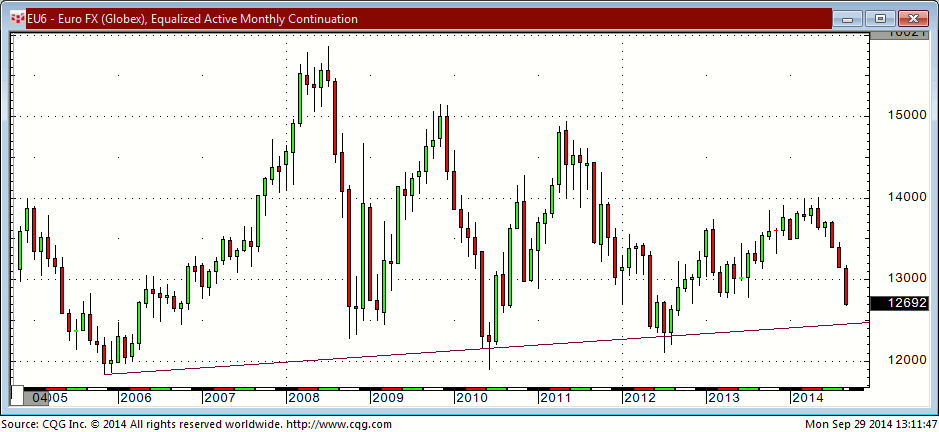
Below are presented the daily, weekly, monthly, and quarterly charts of Euro Futures traded on Globex:
It was difficult to even draw a trend-line on the daily chart because since June there have been few levels where the currency seems to have gained any significant support.
In the weekly chart below, I draw a trend-line starting with a support level gained in July of 2012. From this point, we saw a rather solid upward trend established. From the week of July 21, 2014 to present we have seen the trend-line violated and only 2 weeks where the contract closes very slightly higher.
The Daily and Weekly Makes Us Beg for Context
Backing up once again for a firmer understanding of the implications of this euro move and taking a look at the monthly chart, finally presents to us some support levels to monitor. The trend-line drawn shows that around the 1.24 price we might expect some consolidation.
Finally, we get to the really interesting quarterly chart which reveals to us what the monthly chart couldn’t possibly. This is the most crucial information. If we trade through the 1.24 price level, there could not only be technical implications but major fundamental implications, also.


[…] Mixed Market Artist highlighted the selloff of the Euro in DAZZLING DOLLAR VS EURO MOVE! (SEE THE BIG PICTURE). […]