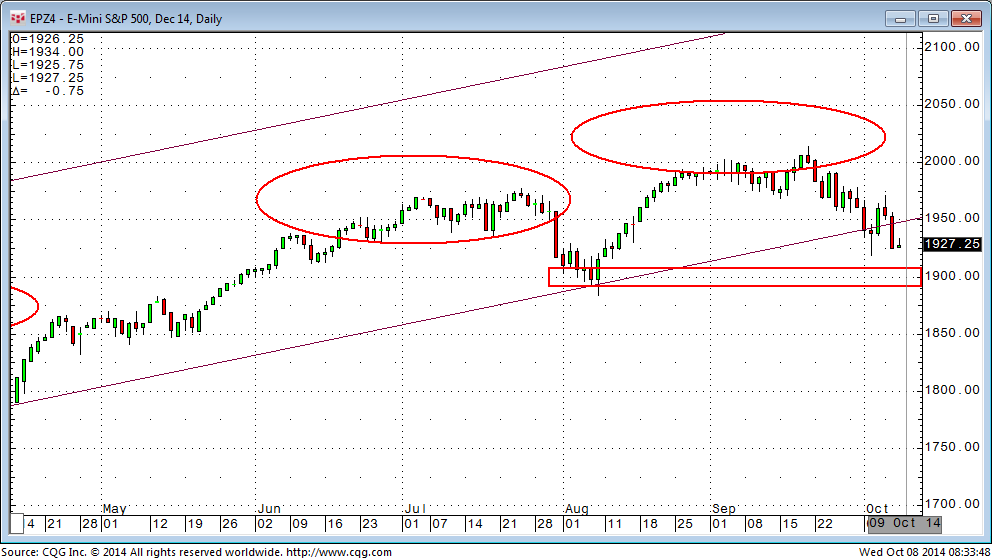
After observing the technical analysis of the last post on the S and P 500 futures, observe the next level where we might expect to see consolidation – around the psychological 1900 price point. Observe where the rectangle is drawn in the chart. Failing to consolidate at this level should portend a continued sell-off.
All posts tagged s and p 500 futures
Will the Stock Market Gather Support?
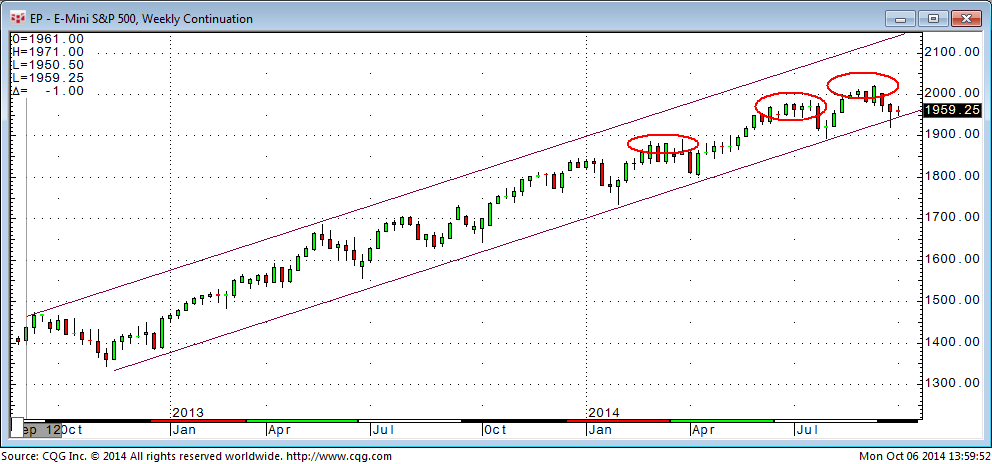
Take a look at the trend channel and the ellipses drawn into the weekly chart of the Standard and Poor 500 futures chart. The rally of 2013 pictured in the chart sure does appear very persistent and orderly! (Easy money policy works?) Failing to rally this week will bring us closer to penetrating the bottom trend-line at 1950.50. Obviously,…